When it comes to applying for college, most students will need to factor data into their decision process. Whether this is acceptance or rejection statistics, the rate of men to women or the average annual income of graduates, statistics play an important role in the college admissions process.
That’s why we’ve put together this list of need-to-know college statistics for 2020. From online college statistics to data on financial aid, you’re sure to find everything you need that will help you make the most informed decision on the best college for you.
Table of Contents:
General Statistics

Before you begin narrowing down where you belong, you first need to know about the overall landscape of college. Here’s a snapshot of some general college statistics to be aware of.
All statistics gathered from the National Student Clearinghouse Research Center are noted as “estimates” due to some Title IV institutions not participating or sharing student data with NSCRC.
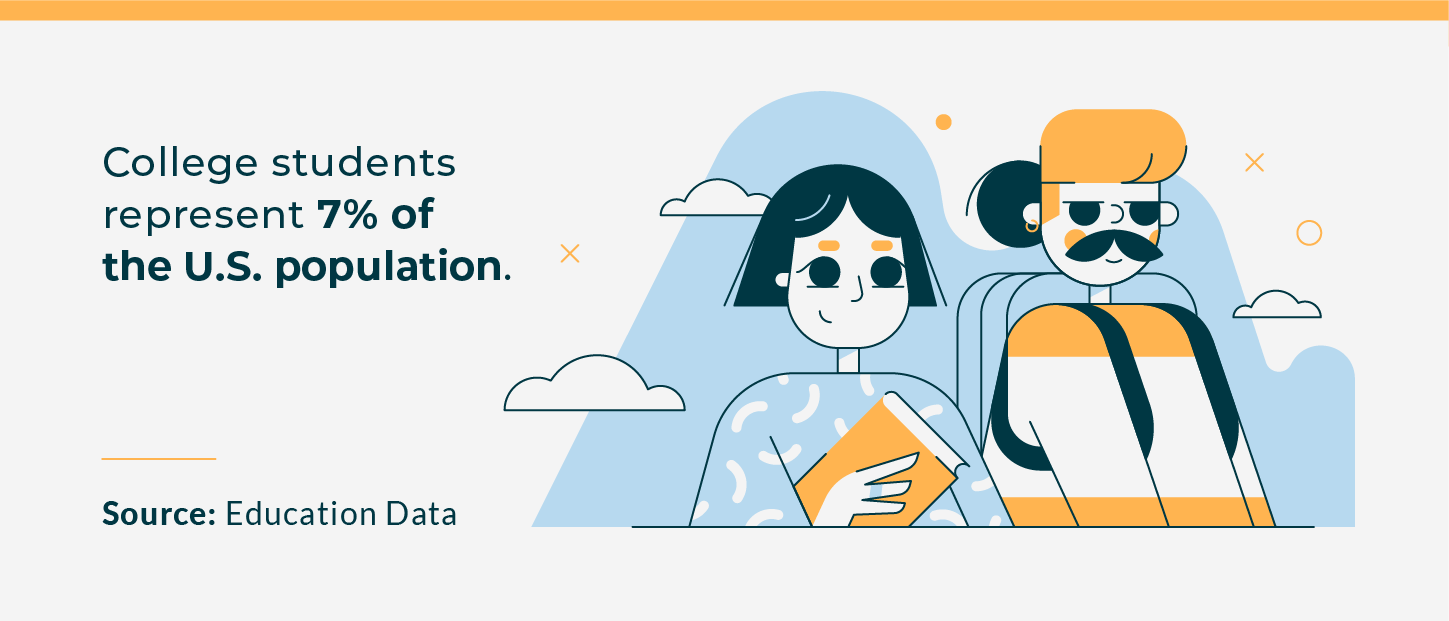
- College students represent 7% of the U.S. population (Education Data)
- Between 2018 and 2019, there were 21.9 million students enrolled in a college or university (Education Data)
- Of the approximately 18,239,874 students who enrolled in fall 2019: (National Student Clearinghouse Research Center)
- 11,734,219 students were enrolled full-time at all institutions
- 6,505,655 were enrolled part-time at all institutions
College Demographics
Below, you’ll find some statistics on the general demographics of both public and private institutions, in terms of age, gender, ethnicity and economic status.
Age
It’s never too late to begin higher education, and many universities see a large population of students aged over 25. (National Student Clearinghouse Research Center)
- In fall 2019, 10,999,757 students enrolled in college were aged 18 to 24, while 6,197,591 were over the age of 24
- As of fall 2019, the average age of students enrolled in undergraduate programs full-time was 21.8 years old
- Students enrolled part-time in undergraduate programs averaged age 27.2
- In fall 2018, students enrolled in graduate programs full-time averaged age 29.7
- Students enrolled part-time in graduate programs averaged age 34.9
- In fall 2019, 973,157 students attending a public, 4-year institution for the first time were between the ages of 18 and 24
- 38,411 were age 24 or older
- 986,623 students aged 18 and over enrolled in 2-year institutions in fall 2019
-
- 865,173 were between the ages of 18 and 24
- 121,450 were 24 or older
-
Gender
Besides all-men or all-women institutions, knowing the gender statistics at your future college is important to ensure a well-rounded environment to learn in.
- As of fall 2019: (National Student Clearinghouse Research Center)
- 7,606,756 men were enrolled in college
- 10,633,118 women were enrolled in college
- In 2018, college admission rates for recent high school graduates between the ages of 16 and 24 were: (National Center for Education Statistics)
- 71.3% for female students
- 66.9% for male students
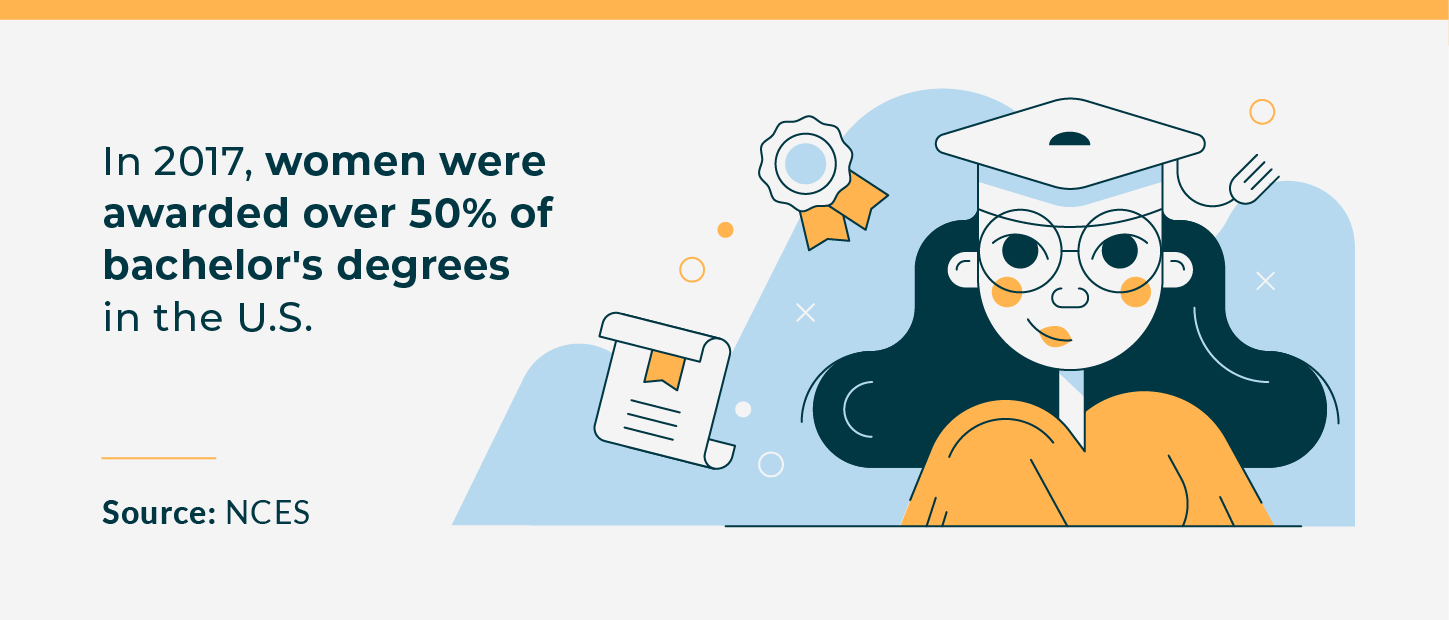
- In 2017, women were awarded over 50% of bachelor’s degrees in the U.S. (NCES)
Ethnicity
Having a diverse student population is vital to a university to ensure different voices and various backgrounds are represented across different backgrounds can be learned from in the classroom.
Of the 26,436,441 students enrolled in both undergraduate and graduate programs in the 2017–2018 school year: (NCES)
- 190,932 were American Indian or Alaska Native
- 1,589,075 were Asian
- 3,412,421 were Black or African American
- 4,615,816 were Hispanic or Latinx
- 69,887 were Native Hawaiian or Other Pacific Islander
- 13,109,459 were White
Economic Status
The most recent data collected in 2016 from the Pew Research Center found that:
- Students from the highest quintile of socioeconomic status are 50% more likely to enroll in college than the lowest quintile
- 32% of students from the lowest quintile of socioeconomic status pursue a 4-year degree, while 42% pursue a 2-year degree
- 78% of students from the highest quintile of socioeconomic status pursue a 4-year degree, while 13% pursue a 2-year degree
- 37% of students from high-income families enroll at highly selective institutions, while 7% of lower-income students enroll at highly selective institutions
Institutional Demographics
Here, you’ll find enrollment, acceptance, age and graduation data specifically broken down by private (both not-for-profit and for-profit) and public institutions (four- and two-year).
- The following represent statistics for 4-year institutions, as of 2018: (Education Data)
- 27% had open admission policies in place
- 14% granted admission to less than half of their applicants
- 30% granted admission to more than half of their applicants
- 29% granted admission to at least 75% of their applicants
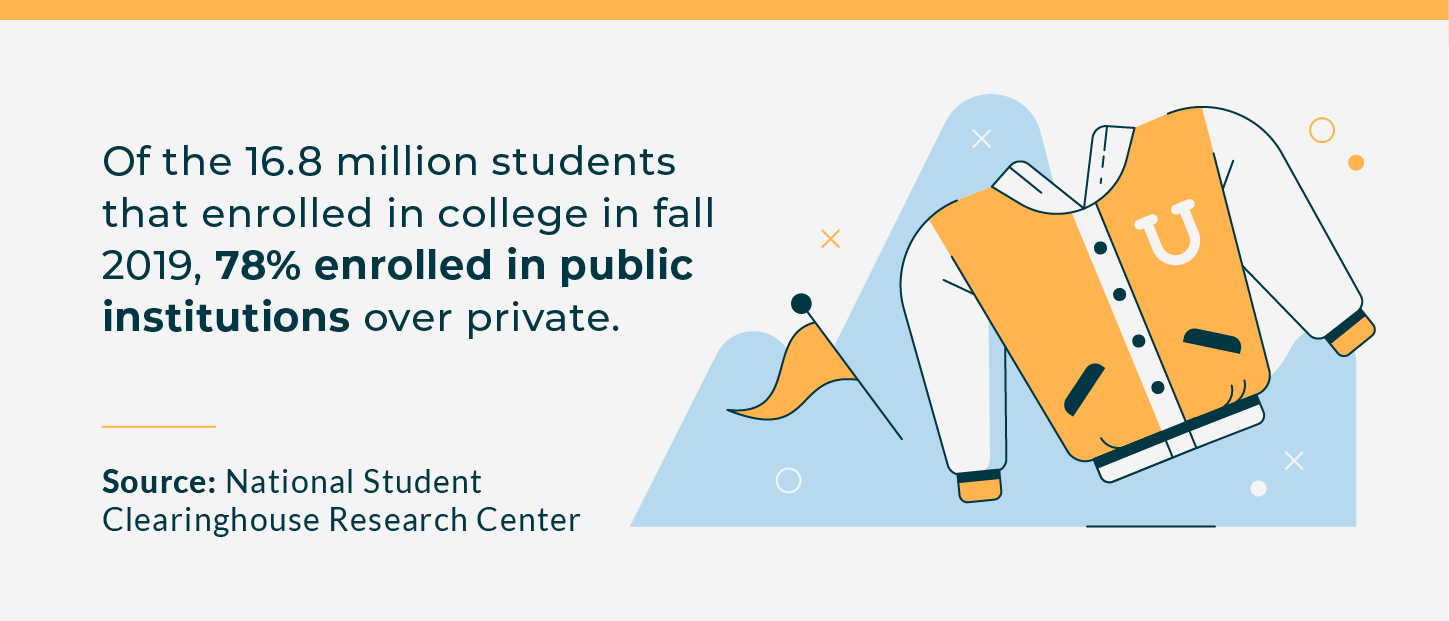
- Of the 18,239,874 students enrolled in college in fall 2019, 4,592,815 were enrolled in private institutions (National Student Clearinghouse Research Center)
- 3,842,930 students were enrolled full-time in a non-profit private college, and 786,758 students were enrolled part-time
- 456,846 students were enrolled full-time in a for-profit private college, while 293,039 students were enrolled part-time
- 13,258,454 students were enrolled in public institutions in fall 2019
- 5,947,219 students enrolled full-time at 4-year institutions, while 2,042,764 enrolled part-time
- 2,039,841 students enrolled full-time at 2-year institutions, while 3,328,629 enrolled part-time
Retention Statistics
- In 2018, the full-time retention rate in private non-profit institutions was 81.2% for 4 or more years (NCES)
- 72.2% graduated as full-time students in at least 2, but less than 4 years
- In 2018, the full-time retention rate in private for-profit institutions was 59.8% for 4 or more years (NCES)
- 67.8% graduated as full-time students in at least 2, but less than 4 years
- In 2018, the full-time retention rate in public institutions was 81.2% for 4 or more years (NCES)
- 62.1% graduated as full-time students in at least 2, but less than 4 years
- In 2018, the full-time retention rate in 2-year public institutions was 62.1% for at least 2 but less than 4 years (NCES)
Online College Statistics

Online college is an excellent option while considering all of your options. Below, you’ll find all the need-to-know information on online college and distance learning, broken down by enrollment statistics and degrees sought.
Enrollment Statistics
When weighing distance learning or online college options, it can be beneficial to see just how many students have successfully enrolled in online college courses.
- In fall 2018, there were 6,932,074 students enrolled in at least one distance learning course at degree-granting institutions (NCES)
- 33.8% were undergraduate students (NCES)
- 39.8% were graduate students
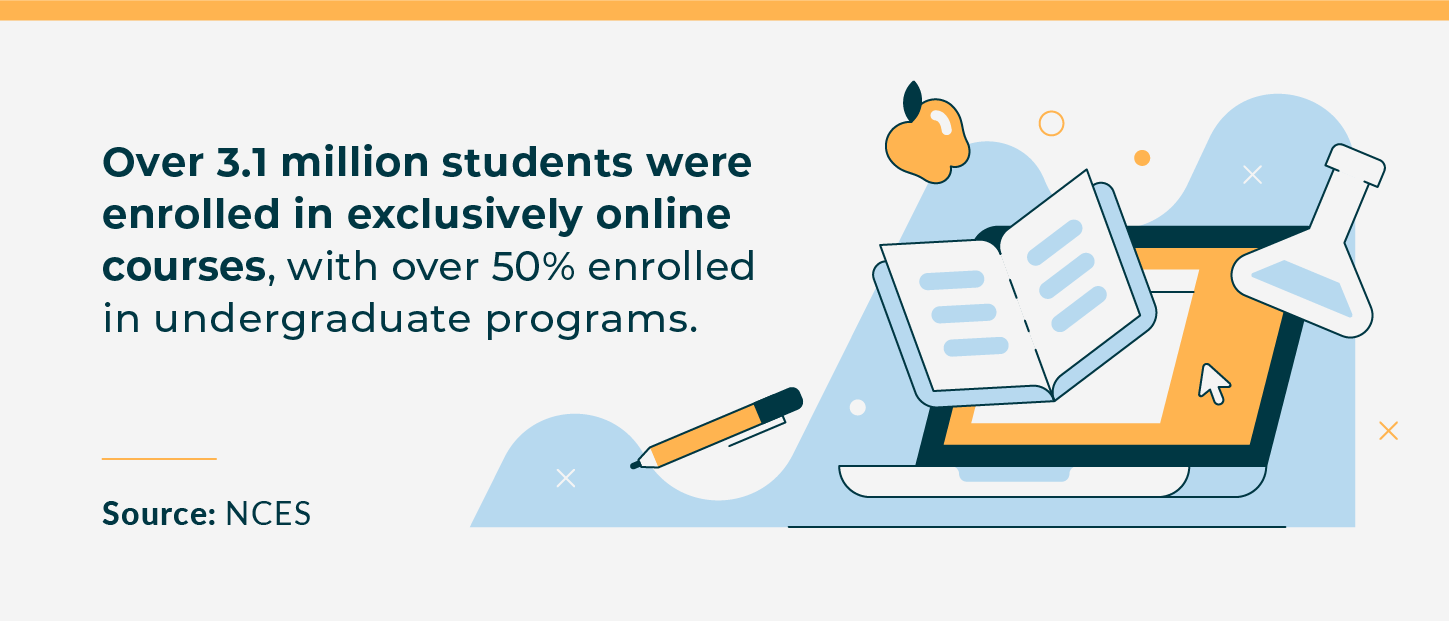
- Of the 3,257,987 students enrolled in exclusively distance learning courses: (NCES)
- 2,325,142 were enrolled in undergraduate programs
- 932,845 were enrolled in post-baccalaureate programs
- 1,806,382 attended public institutions
- 837,479 attended private not-for-profit institutions
- 614,126 attended private for-profit institutions
- Of the 3,674,087 students enrolled in at least one, but not all, distance learning courses: (NCES)
- 3,399,567 were enrolled in undergraduate programs
- 274,520 were enrolled in post-baccalaureate programs
- 3,153,470 attended public institutions
- 418,048 attended private not-for-profit institutions
- 102,569 attended private for-profit institutions
The 10 states with the highest percentage of students enrolled in exclusively distance education courses, as of 2018, are: (NCES)
-
- New Hampshire: 68.3%
- Arizona: 42.5%
- West Virginia: 41.6%
- Utah: 40.2%
- Minnesota: 31.4%
- North Dakota: 26.5%
- Idaho: 25.7%
- Alaska: 25.5%
- Colorado: 23%
- South Dakota: 23%
Degrees Sought
As of 2018, the percentage of students enrolled in distance education courses by highest degree offered were:
- 14% of students pursuing an associate’s degree in 2018 were enrolled in exclusively distance learning classes (NCES)
- 20.3% were enrolled in some, but not exclusively distance learning programs
- 14.1% of students pursuing a bachelor’s degree in 2018 were enrolled in exclusively distance learning programs (NCES)
- 19.2% were enrolled in some, but not exclusively distance learning programs
- 25.8% of the students pursuing a master’s degree in 2018 were enrolled in exclusively distance learning programs (NCES)
- 16.1% were enrolled in some, but not exclusively distance learning programs
Financial Aid Statistics

If you need some financial aid assistance to make college more affordable, we’ve got you covered. Here you’ll find data on financial aid of all kinds, from Pell grants and scholarships to local government loans.
- Each year, more than $120 billion is given out in grants, work-study and loan funds each year from the office of Federal Student Aid
- In 2018–19, undergraduate and graduate students received a total of $246 billion in student aid from work study, federal loans and federal tax credits (College Board)
- For graduate students:
- $18,470 was the average loan size per full-time or equivalent graduate student
- The average grant aid was $8,920
- The average other aid was $750
- For undergraduate students:
- $4,410 was the average loan size per full-time or equivalent undergraduate student
- The average grant aid was $9,520
- The average other aid was $1,280
- For graduate students:
Scholarship Statistics
Some students are able to subsidize their education by applying for scholarships, whether they are ones offered through their institution or through other organizations.
In the 2017–18 school year, the number of full-time, first-time students receiving aid was as follows: (NCES)
- At public institutions, 1,469,258 students received any type of financial aid
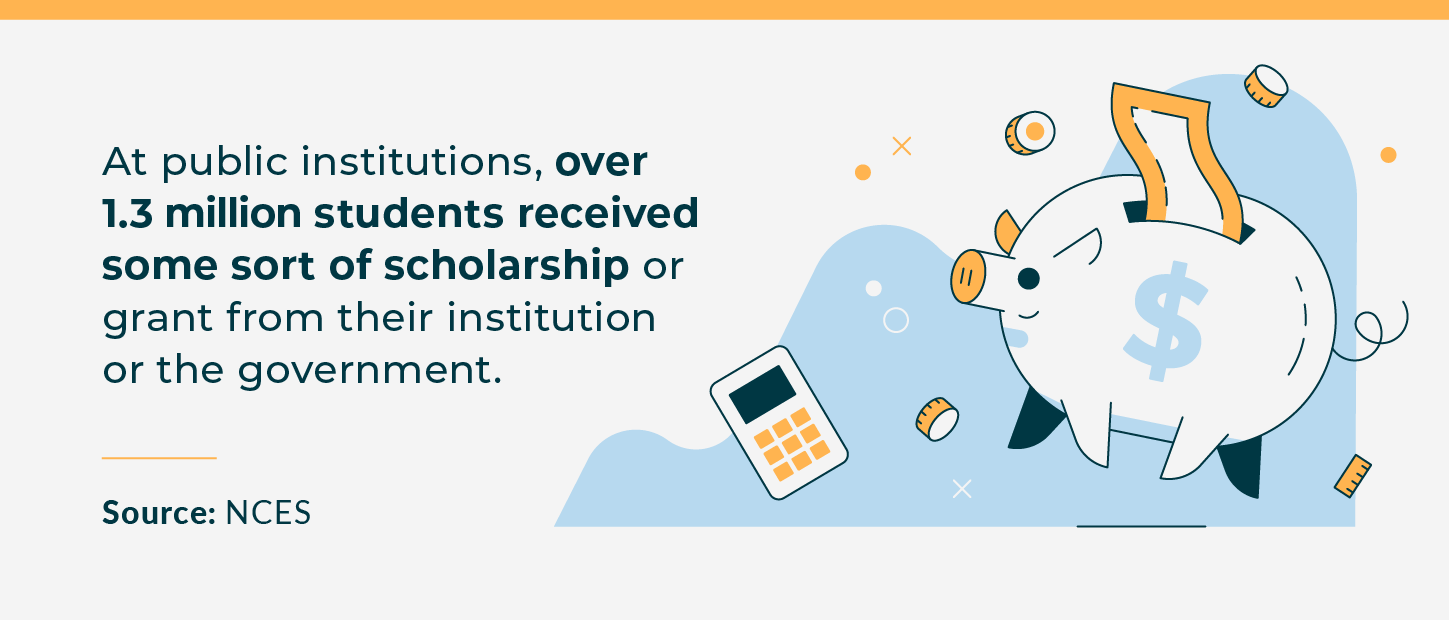
- 1,303,361 students received scholarships or grants from the local, state or federal government, or the institution
- 779,699 received federal grants
- 771,964 received Pell grants
- 162,001 received other federal grants
- 699,813 received government grants or scholarships
- 691,138 received institutional grants or scholarships
- 662,092 received loans to students
- 651,016 received federal loans
- 71,463 received other loans
- 1,303,361 students received scholarships or grants from the local, state or federal government, or the institution
- At private not-for-profit institutions, 503,273 students received any type of financial aid (NCES)
- 485,793 students received scholarships or grants from the local, state or federal government, or the institution
- 202,207 received federal grants
- 200,310 received Pell grants
- 77,531 received other federal grants
- 132,624 received government grants or scholarships
- 436,921 received institutional grants or scholarships
- 336,993 students received loans for students
- 330,490 received federal loans
- 55,397 received other loans
- 485,793 students received scholarships or grants from the local, state or federal government, or the institution
- At private for-profit institutions, 255,008 students received any type of financial aid
- 222,124 students received scholarships or grants from the local, state or federal government, or the institution
- 207,358 received federal grants
- 206,185 received Pell grants
- 52,408 received other federal grants
- 15,680 received government grants or scholarships
- 40,697 received institutional grants or scholarships
- 210,785 received loans to students
- 207,612 received federal loans
- 24,593 received other loans
- 222,124 students received scholarships or grants from the local, state or federal government, or the institution
Post-Graduation Statistics

In the grand scheme of things, college is just a stepping stone to the next phase of your life: landing the perfect job! You want to be sure your college decision is going to set you up for success, which is why we’ve gathered the statistics you’ll want to know for making the best decision for your future.
Here, you’ll find relevant data on employment rates post-grad as well as average debt, so you have all you need to be as informed as possible.
Employment Rate
One of the biggest returns on investment in attending college is knowing your education is setting you up to land a great job in the future.
- In total, 85% of U.S. men aged 25 to 34 in 2019 were employed (NCES)
- 86% with some college, no bachelor’s degree were employed
- 91% with bachelor’s or higher degree were employed
- In total, 73% of U.S. women aged 25 to 34 in 2019 were employed (NCES)
- 74% with some college, no bachelor’s degree were employed
- 83% with bachelor’s or higher degree were employed
- On average in 2019, the employment rate for female 25- to 34-year-olds with a bachelor’s degree or higher was 44% higher than for similar individuals who had not completed high school (NCES)
Average Student Loan Debt Upon Graduating
Knowing how you’re paying for college is important, especially when determining how much money in student loans or scholarships you will need. Seeing the average debt of graduates can help prepare you for how much aid you may need.
Student loans are given out either by the federal government in the FAFSA program or through private lenders. Students can take out subsidized or unsubsidized loans, depending on how they qualify through FAFSA.
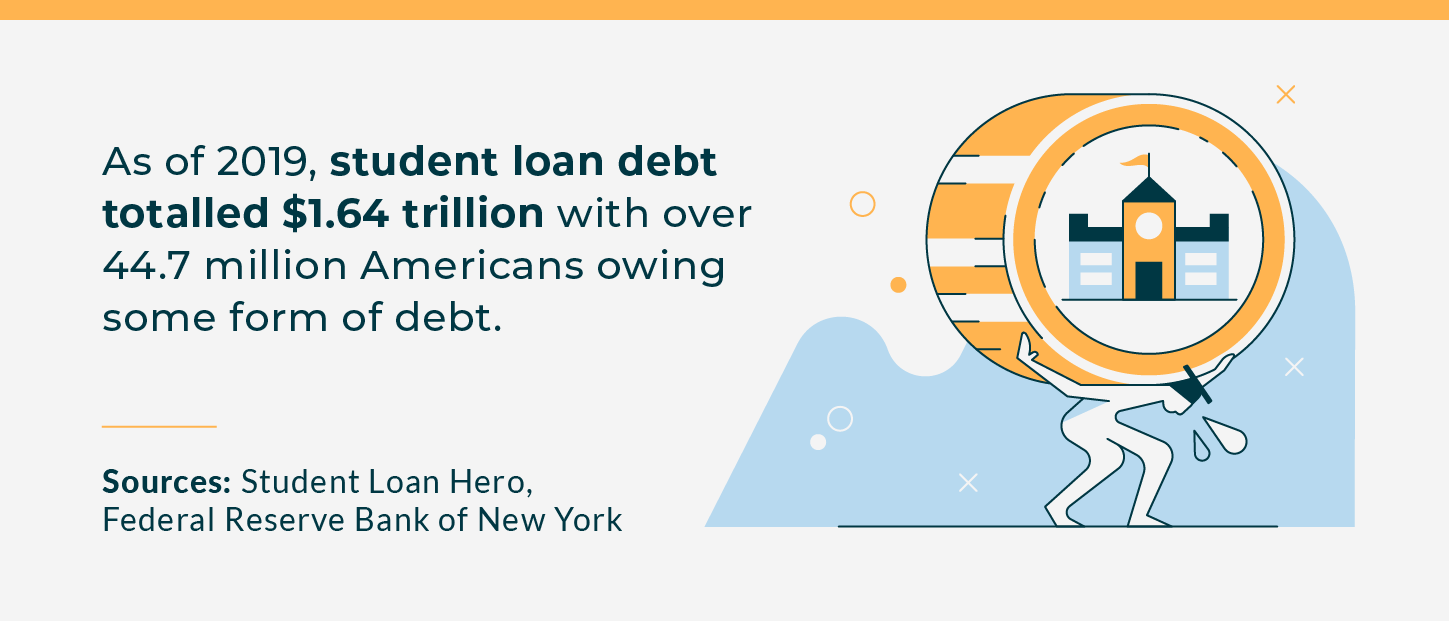
- As of 2019, U.S. student loan debt totaled over $1.64 trillion. (Student Loan Hero)
- 69% of seniors graduating with a four-year degree in 2019 had student loan debt (College Board)
- The class of 2019 graduated with an average student loan debt of $29,900 (Student Loan Hero)
- 44.7 million Americans have student loan debt (Student Loan Hero)
- The monthly student loan payment ranges between $200 to $299, on average (Student Loan Hero)
- 66% of graduates from public colleges had an average debt of $26,900 (The Institute for College Access & Success)
- 68% of graduates from private, not-for-profit colleges had an average debt of $31,450 (TICAS)
- 83% of graduates from private, for-profit colleges had an average debt of $39,900 (TICAS)
When it comes time to find the perfect college and major for you, a lot of factors come into play. From the courses offered to the employment rate post-graduation, you want to feel confident that your decision on where you’ll be spending your valuable time and money is the best choice for you.
Through using these statistics, you’ll be able to take a more data-driven approach to making this important decision. You’ll be able to see where statistically the best fit is for you, and can proceed confidently from there!
Sources: Education Data | Student Loan Hero


